
The gap: most QR codes are created without measurement
"Campaign tracking parameters" in this analysis means query-string fields that signal explicit attribution intent — UTM parameters (utm_source,utm_medium,utm_campaign), Google'sgclid, and similar. These fields allow a marketer to connect a QR scan to a downstream analytics platform and ultimately to a conversion or revenue outcome.
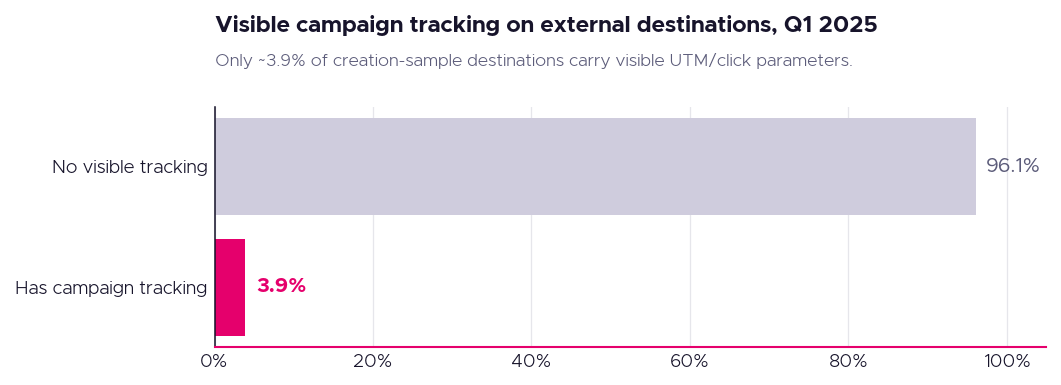
In the Q1 2025 QRStuff destination sample of 63,691 external URLs, only 3.9% carried these parameters at the point of code creation. This is a creation-weighted measure — it reflects what creators embed when they first set up a code, not what they might add later via a redirect. The 96.1% without visible attribution tags at creation time may still use QRStuff's platform scan analytics (which track scans at the platform level), but they are not connecting QR traffic to downstream conversion data through the destination URL.
Of external QR destinations in the Q1 2025 QRStuff creation sample carried visible campaign tracking parameters (UTM, gclid, etc.). Among the top 1,000 highest-traffic short URLs in January 2025, that rate rises to 12.5% — a 3.2× lift. Source: QRStuff platform data, Q1 2025 destination sample and January 2025 scan-weighted top 1k.
destination_external_campaign_params_2025_q1_100k.json, destination_scan_weighted_external_campaign_params_2025_01_top1000.live.jsonHow mature QR programmes behave differently
The scan-weighted analysis of the top 1,000 short URLs by January 2025 scan count reveals a consistent pattern: more-scanned codes carry more tracking, more homepages, and — by inference — belong to more intentional programmes. The 3.2× lift in tracking prevalence (3.9% → 12.5%) among high-traffic codes suggests that operators who invest in QR systematically are also the ones who instrument it most carefully.
This association (more scans, more tracking) does not establish causation — it could mean that tracked codes get more scans because they're in better-designed campaigns, or that campaigns large enough to generate high scan volumes are also resourced to add tracking. Both interpretations support the same conclusion: measurement and scale tend to go together.
External research confirms the gap
QRStuff's first-party destination data is directionally consistent with external research. Uniqode's 2025 survey of 524 U.S. marketers found that only 12% report connecting QR scans to revenue, and that analytics is simultaneously the most-valued and most-wanted-improved QR feature. Separately, Uniqode found 71% of consumers say QR codes are useful in daily life — confirming that consumer adoption is not the bottleneck; marketer measurement capability is.
The implication for QR programmes is practical: adding UTM parameters to QR destinations at creation is a low-effort, high-value step. It connects existing QR scan platform data to downstream conversion data without changing the user experience.
Report figures
Charts & Visualizations
Figure 4 · Campaign Tracking Prevalence

Bar chart comparing creation-sample tracking prevalence with top-scanned-code tracking prevalence.
The gap: most QR codes are created without measurement
"Campaign tracking parameters" in this analysis means query-string fields that signal explicit attribution intent — UTM parameters (utm_source,utm_medium,utm_campaign), Google'sgclid, and similar. These fields allow a marketer to connect a QR scan to a downstream analytics platform and ultimately to a conversion or revenue outcome.
In the Q1 2025 QRStuff destination sample of 63,691 external URLs, only 3.9% carried these parameters at the point of code creation. This is a creation-weighted measure — it reflects what creators embed when they first set up a code, not what they might add later via a redirect. The 96.1% without visible attribution tags at creation time may still use QRStuff's platform scan analytics (which track scans at the platform level), but they are not connecting QR traffic to downstream conversion data through the destination URL.
Of external QR destinations in the Q1 2025 QRStuff creation sample carried visible campaign tracking parameters (UTM, gclid, etc.). Among the top 1,000 highest-traffic short URLs in January 2025, that rate rises to 12.5% — a 3.2× lift. Source: QRStuff platform data, Q1 2025 destination sample and January 2025 scan-weighted top 1k.
destination_external_campaign_params_2025_q1_100k.json, destination_scan_weighted_external_campaign_params_2025_01_top1000.live.jsonHow mature QR programmes behave differently
The scan-weighted analysis of the top 1,000 short URLs by January 2025 scan count reveals a consistent pattern: more-scanned codes carry more tracking, more homepages, and — by inference — belong to more intentional programmes. The 3.2× lift in tracking prevalence (3.9% → 12.5%) among high-traffic codes suggests that operators who invest in QR systematically are also the ones who instrument it most carefully.
This association (more scans, more tracking) does not establish causation — it could mean that tracked codes get more scans because they're in better-designed campaigns, or that campaigns large enough to generate high scan volumes are also resourced to add tracking. Both interpretations support the same conclusion: measurement and scale tend to go together.
External research confirms the gap
QRStuff's first-party destination data is directionally consistent with external research. Uniqode's 2025 survey of 524 U.S. marketers found that only 12% report connecting QR scans to revenue, and that analytics is simultaneously the most-valued and most-wanted-improved QR feature. Separately, Uniqode found 71% of consumers say QR codes are useful in daily life — confirming that consumer adoption is not the bottleneck; marketer measurement capability is.
The implication for QR programmes is practical: adding UTM parameters to QR destinations at creation is a low-effort, high-value step. It connects existing QR scan platform data to downstream conversion data without changing the user experience.