Embeddable Charts

QRStuff State of QR Codes Report 2026 Embeddable Charts

This page lists the hosted chart PNGs published for the QRStuff State of QR Codes Report 2026. Each chart includes a public image URL and a copy-paste HTML snippet with attribution back to https://www.qrstuff.com/scan-report/.

QR scan volume, 2009-2025
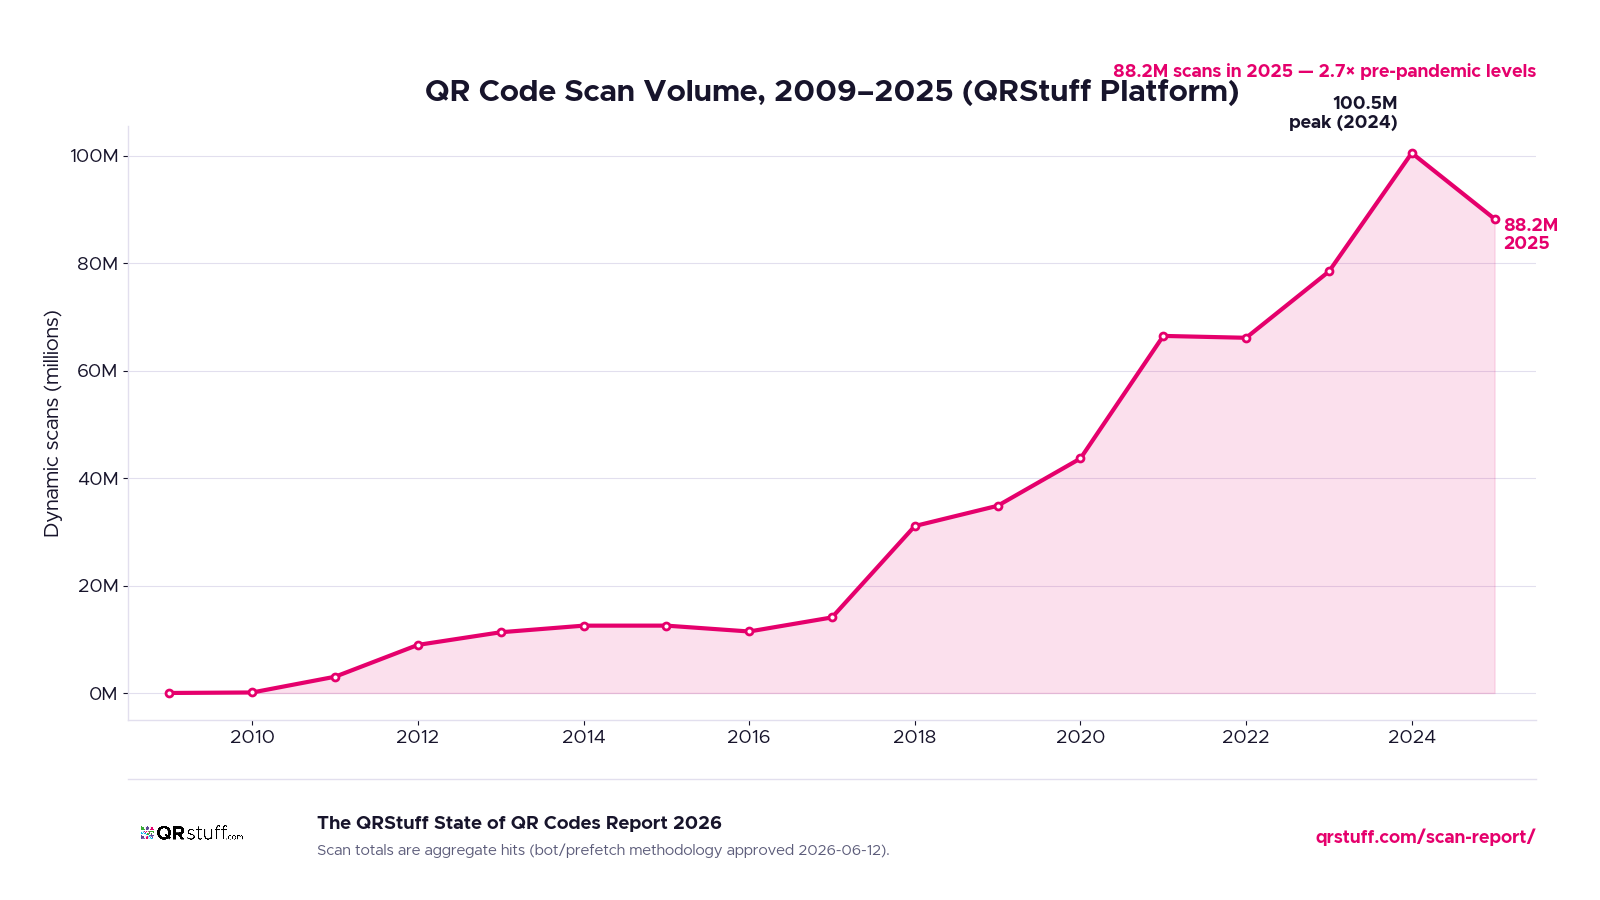
QR scan volume on QRStuff grew from 3,998 in 2009 to 80.7 million in 2025.

QR scan volume from 2009 to 2025

Key stat: 2025 scan volume was 80.7 million.
QR code durability by cohort

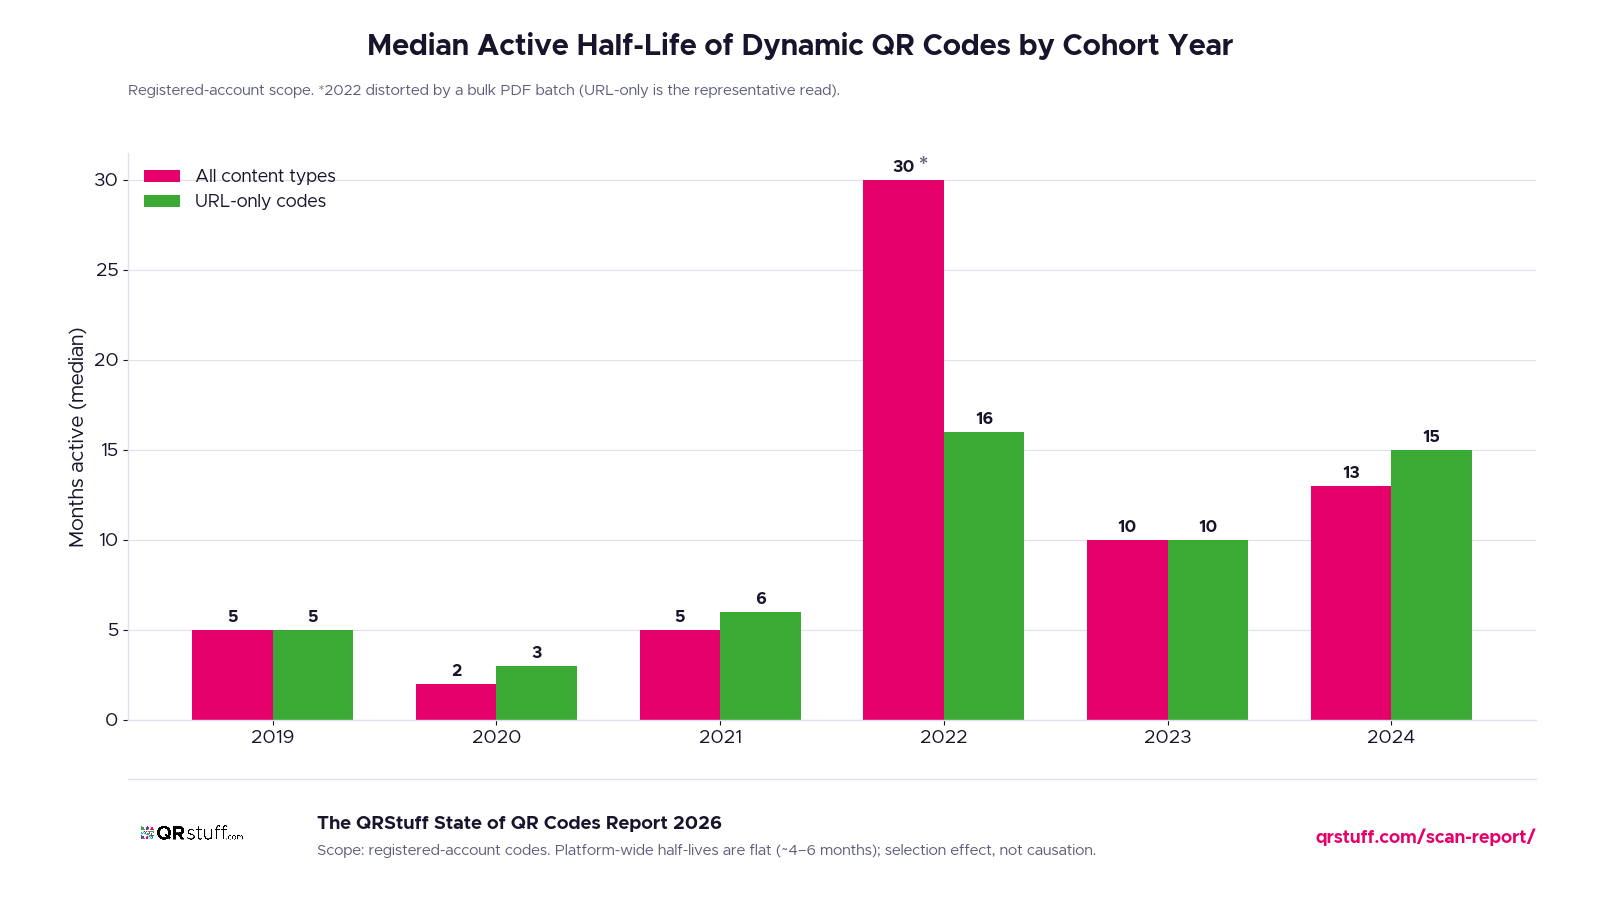
Later cohorts retain usable scan activity longer, with a clear lift among registered-account-created dynamic codes.

QR code durability by cohort

Key stat: 2024 registered-user cohorts show the strongest retained scan activity.
Destination shape, 2025

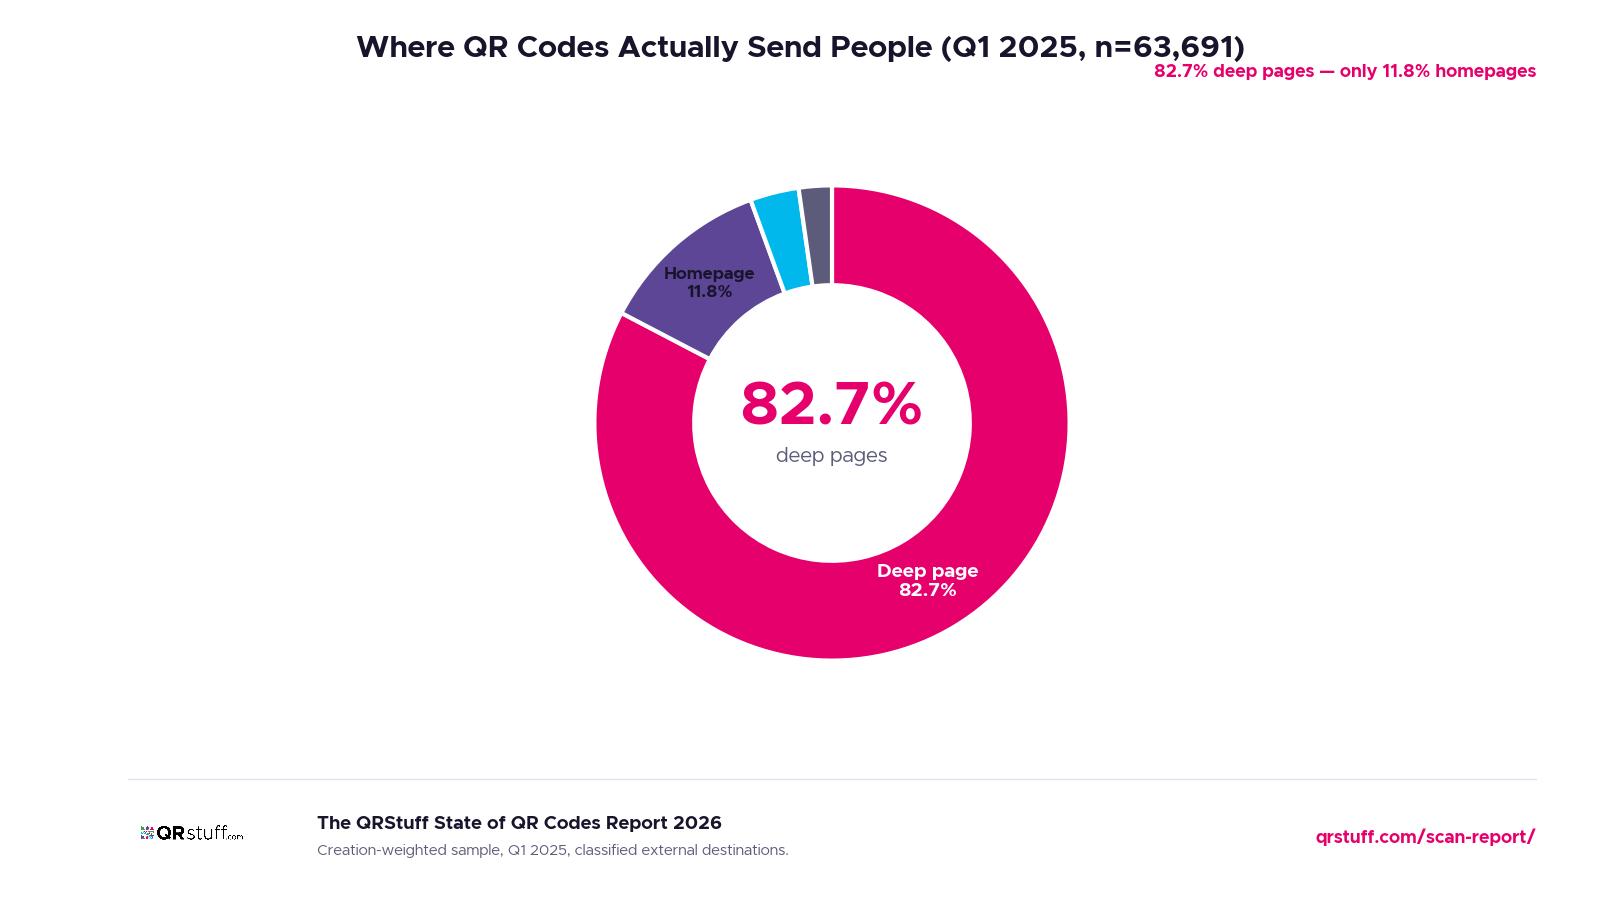
A strong majority of scanned destinations resolve to deep pages rather than homepages.

QR destination shape in 2025

Key stat: 81% of sampled destinations point to deep pages.
Top scan countries, 2025

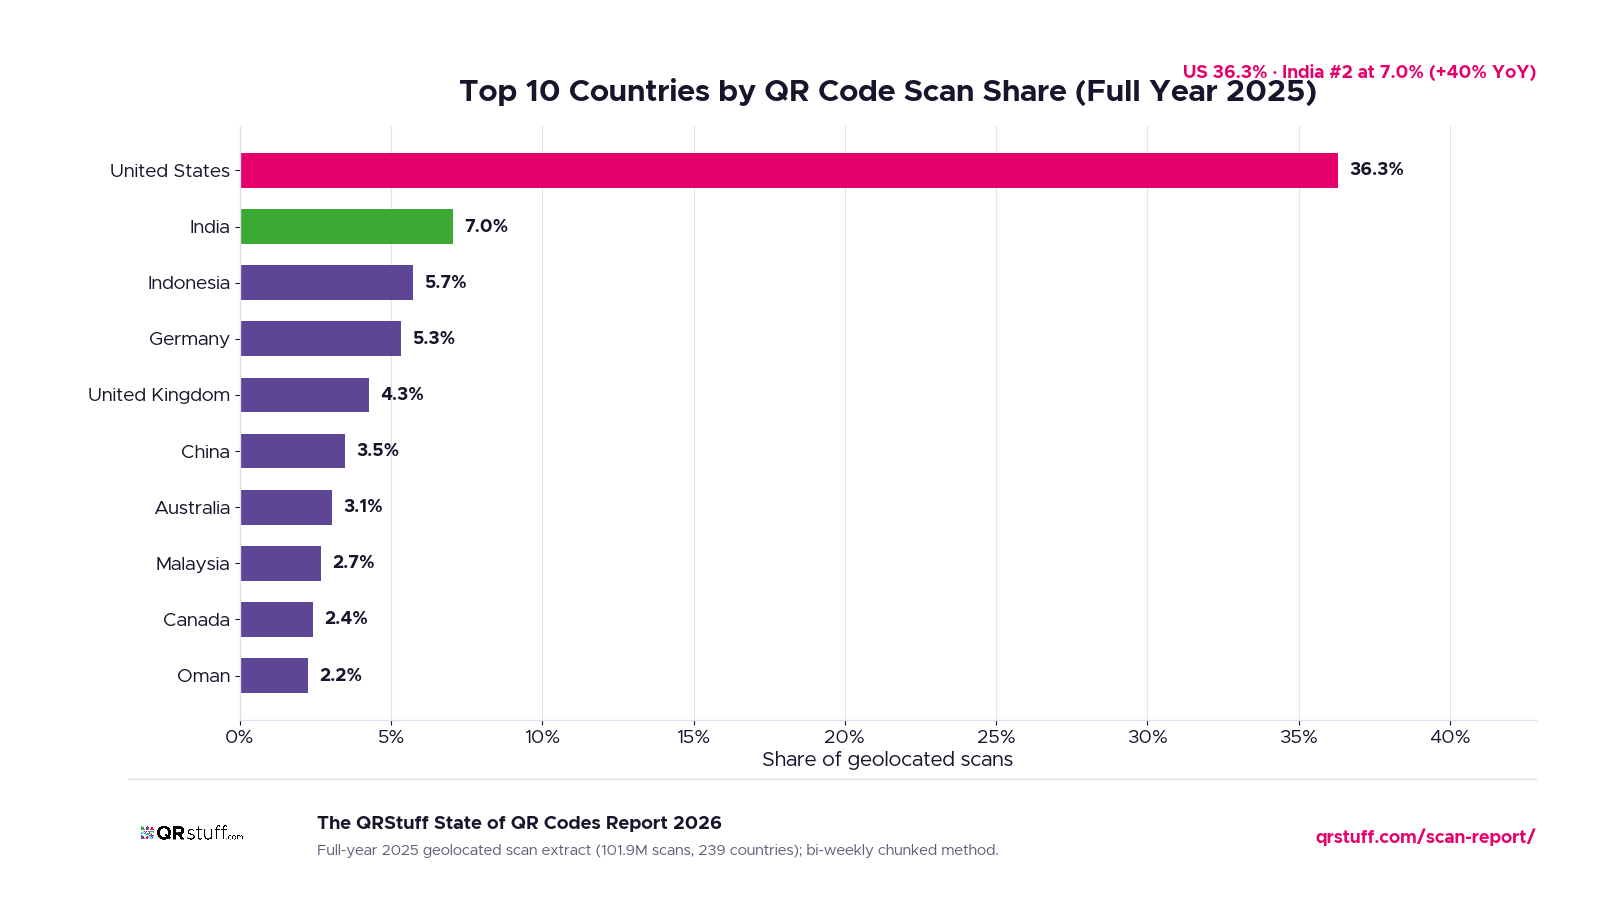
The United States leads 2025 scan volume, followed by India, Canada, the United Kingdom, and Australia.

Top scan countries in 2025

Key stat: The United States accounted for the largest country share of 2025 scans.
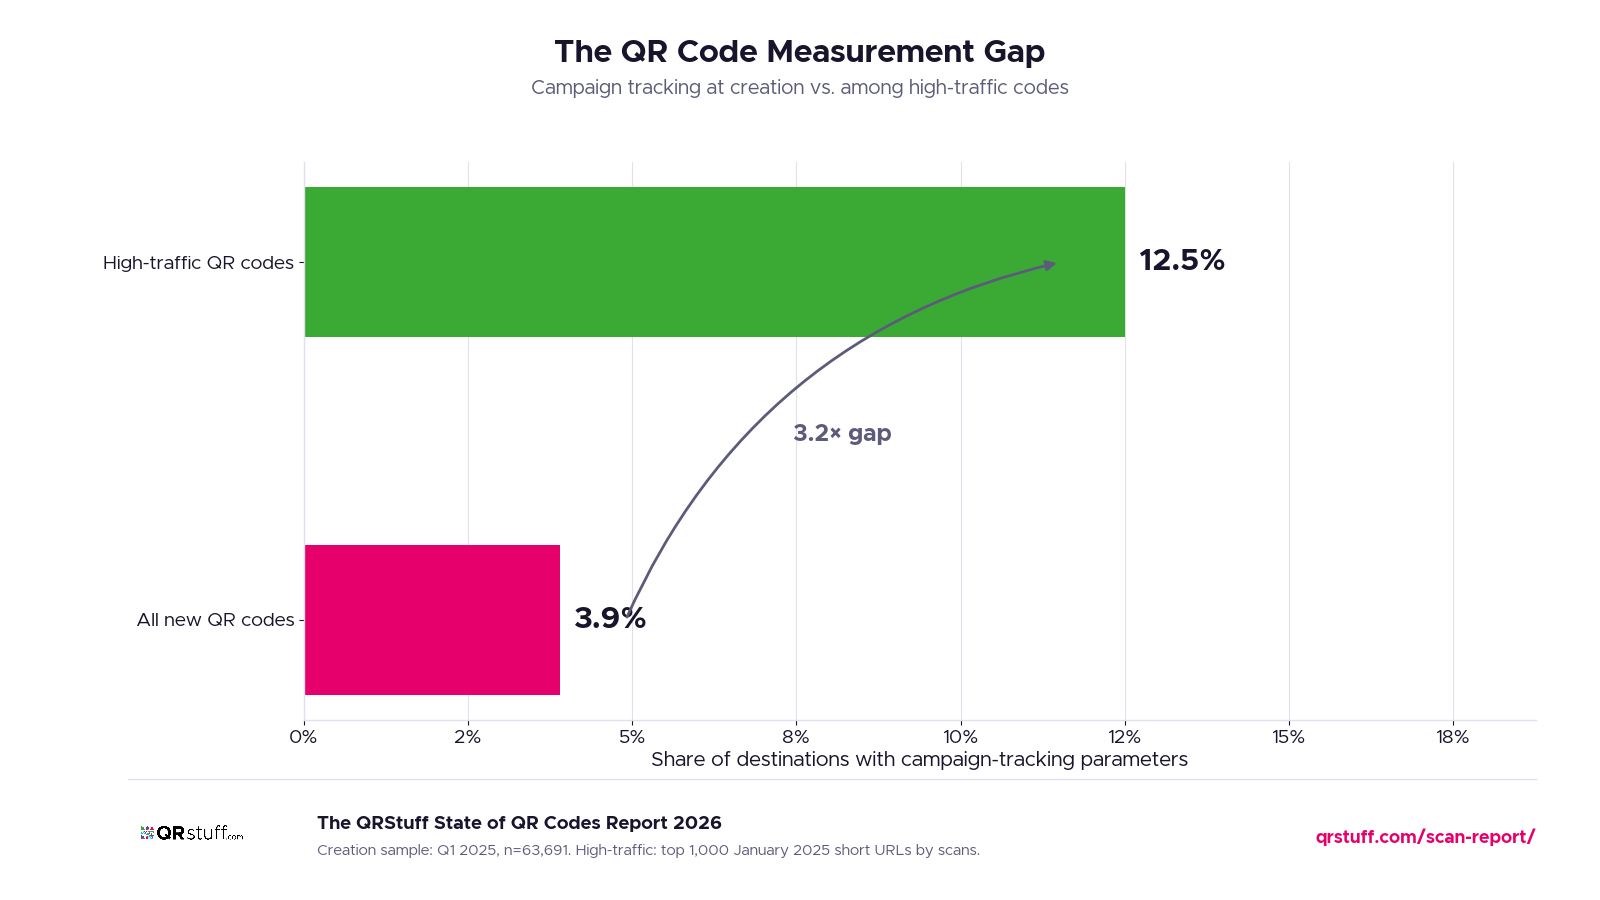
QR code measurement gap

Many QR destinations remain weakly instrumented despite their role in measurable journeys.

QR code measurement gap

Key stat: UTM-style campaign tagging remains far from universal across sampled destinations.
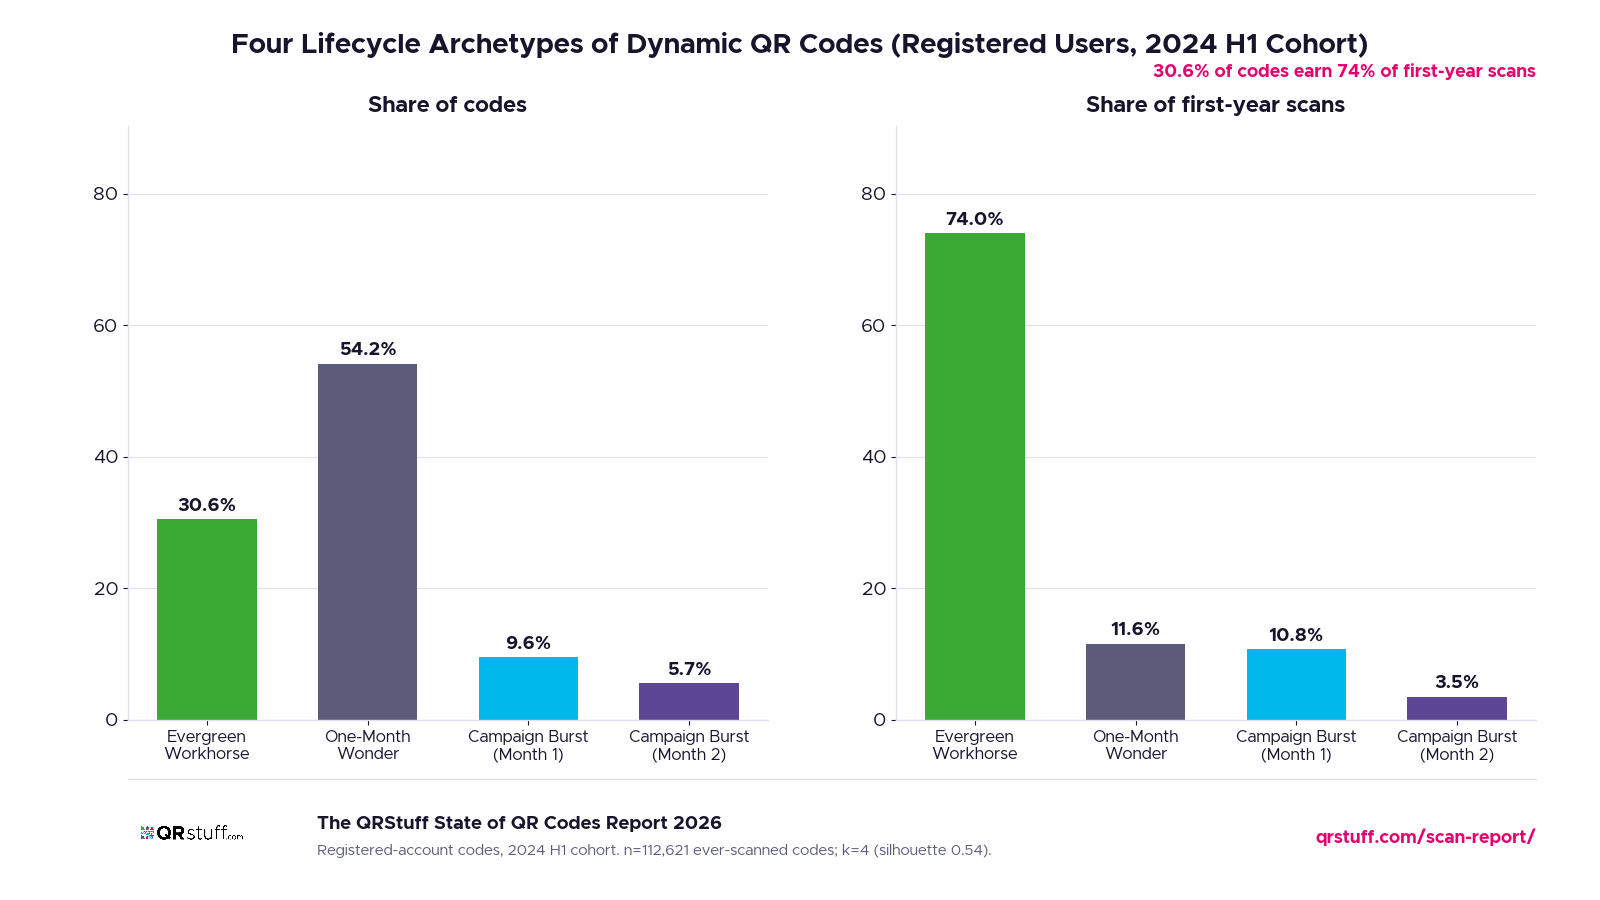
QR code lifecycle archetypes

Four recurring lifecycle patterns emerge across QR code cohorts, from short-lived spikes to durable repeat engagement.

QR code lifecycle archetypes

Key stat: QR code performance clusters into four recurring lifecycle archetypes.