


Where QR Codes Are Scanned: Global Usage by Country
239 countries, 101.9 million geolocated scans, full-year 2025. QR is a genuinely global behaviour — with a shifting map, a rising Asia-Pacific, and a long geographic tail.
Methodology note: The geography data in this chapter covers full-year 2025 (January – December 2025), extracted as 27 bi-weekly 14-day chunks from QRStuff's shorturl_log table (~101.9 million geolocated dynamic QR scans, 239 distinct country codes). Bi-weekly chunking was used because full-quarter GROUP BY queries exceed the read-replica statement timeout on a 580M-row table. Figures reflect the QRStuff platform's customer base (primarily English-language markets and developed economies); they are not a census of all global QR activity. No Visualead-linked account exclusion was applied (that cohort is <0.01% of total scan volume and was also excluded from the 2024 census). k-anonymity threshold: countries with <100 full-year scans are suppressed in public outputs (25 of 239 countries).
QR scanning is a global behaviour
QRStuff's 2025 geography data covers 239 distinct country codes across 101.9 million geolocated scans — the first full-year aggregate the report has published (prior editions used a 30-day census window). The full-year view smooths seasonal and event-driven noise, making it substantially more reliable for understanding geographic distribution than any single-month sample.
Geographic concentration follows a classic power-law distribution: the top 5 countries account for 58.7% of scans, the top 10 for 72.6%, and the remaining 229 countries for the remainder. The US dominance (36.3%) partly reflects that QRStuff is an English-language platform with strong US customer penetration — these figures describe the QRStuff customer base, not a global census of all QR activity.
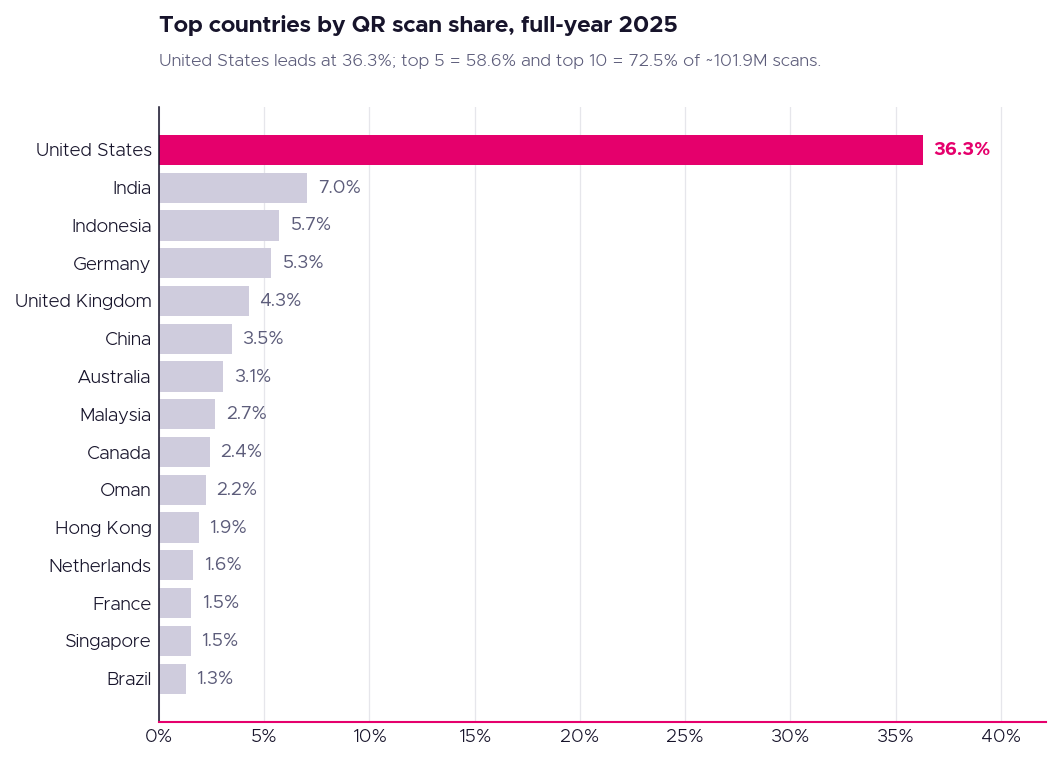
outputs/public/geography_country_top30_2025_full_year.jsonTop countries by QR scan volume (full year 2025)
| Rank | Country | Region | Share of Scans |
|---|---|---|---|
| 1 | United States | North America | 36.3% |
| 2 | India | Asia-Pacific | 7.0% |
| 3 | Indonesia | Asia-Pacific | 5.7% |
| 4 | Germany | Europe | 5.3% |
| 5 | United Kingdom | Europe | 4.3% |
| 6 | China | Asia-Pacific | 3.5% |
| 7 | Australia | Asia-Pacific | 3.1% |
| 8 | Malaysia | Asia-Pacific | 2.7% |
| 9 | Canada | North America | 2.4% |
| 10 | Oman | Middle East & North Africa | 2.2% |
Regional distribution — and a shifting map
At the regional level, North America led with 38.7% of scans in 2025, followed by Asia-Pacific at 28.2% and Europe at 21.0%. Compared with full-year 2024 (same bi-weekly extract method), the most notable shift is Asia-Pacific's rise (+2.0 percentage points, driven by India) while North America's share declined (−4.6 percentage points) on a larger absolute scan base.
Asia-Pacific's share of QRStuff scans in full-year 2025 — up from 26.2% in full-year 2024. India (#2 globally, 7.0%) and Indonesia (#3, 5.7%) remain the largest APAC markets, reflecting accelerating QR adoption across South and Southeast Asia.
Source: QRStuff State of QR Codes Report 2026, full-year 2025 geography (n≈101.9M geolocated scans). The top-10 country concentration (72.6%) alongside presence in 239 countries confirms QR's status as a mainstream consumer behaviour in developed markets — while a long tail of smaller-volume countries shows adoption continuing to spread. The 2025 full-year data represents a significant upgrade over the prior 30-day 2024 census window, removing seasonal and event-driven noise and providing a substantially more reliable geographic baseline.
How 2025 compares with 2024
The comparable full-year 2024 and 2025 extracts (same bi-weekly chunked method both years) reveal meaningful geographic shifts:
- India: #3 → #2 (4.8% → 7.0%). The single biggest scan-volume mover — India's QR adoption accelerated materially over the past year.
- Indonesia: #2 → #3 (5.2% → 5.7%). Share grew despite slipping one rank.
- Germany: #6 → #4 (3.3% → 5.3%).
- China: #5 → #6 (3.7% → 3.5%).
- Turkey: #10 → #24 — fell out of the top 10 entirely.
- US: still #1 but share fell from 40.1% to 36.3% as the rest of the world grew faster.
Source: geography_country_top30_2024_full_year.json and geography_country_top30_2025_full_year.json. See the interactive rank-change slopegraph.




 English (UK)
 Spanish (ES)
 French (FR)