


How Long QR Codes Stay Active: Lifecycle Analysis
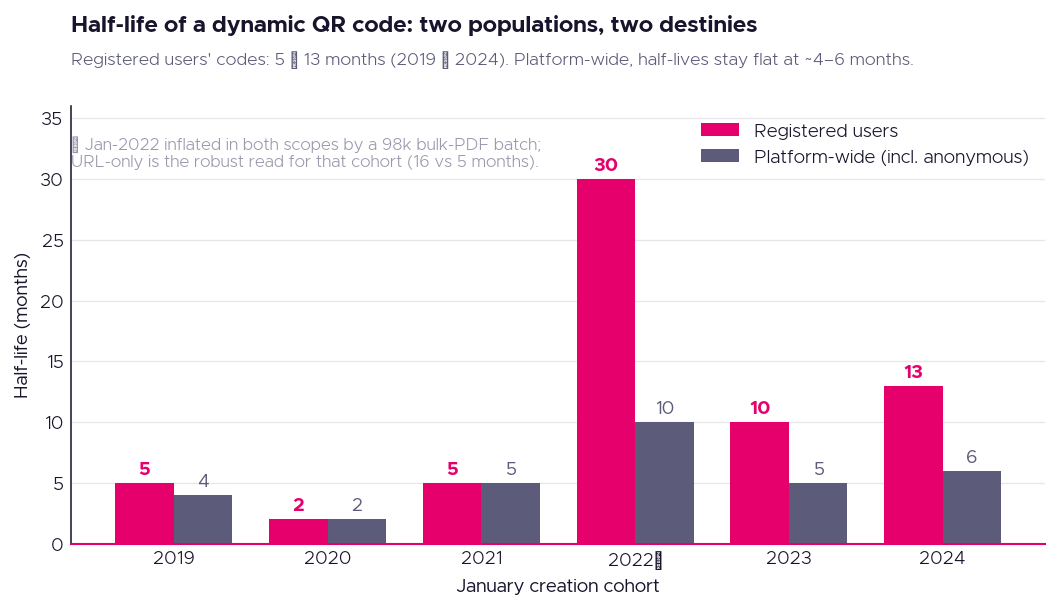
5 months to 13 months: the half-life of a dynamic code created by a registered user, 2019 cohort to 2024 — the clearest signal of QR professionalisation in six years of data.
Scope: The lifecycle findings on this page describe codes created by registered users on the QRStuff platform (i.e., excluding the anonymous/guest bucket, which represents ~70% of codes by count). Platform-wide half-life is flat at approximately 4–6 months since 2019. These findings reflect the professionalisation of QR among active registered accounts — they are a selection effect, not evidence that registering makes codes last longer.
Two QR populations: casual and committed
QRStuff codes come from two distinct populations, and they behave completely differently. Casual codes — created anonymously or in the guest/anonymous bucket — have always been short-lived: a flat half-life of approximately 4–6 months across every cohort from 2019 to 2024. They are designed to be used once or briefly and then abandoned.
Codes created by registered users show a dramatically different pattern. The half-life is defined as the point at which half of the ever-scanned codes in a creation cohort have stopped generating scans. For registered-user codes, this rose from approximately 5 months for the 2019 cohort to 13 months for the 2024 cohort. Website URL codes showed an even sharper rise: 5 months (2019) to 15 months (2024). This is not a survival artifact; it reflects a genuine shift in how registered users deploy and maintain QR codes.
The half-life of a dynamic QR code created by a registered user, rising from the 2019 cohort to the 2024 cohort. URL-only codes: 5 → 15 months. This describes registered accounts only; platform-wide half-life is flat. Source: QRStuff platform data, cohort survival analysis (registered-account scope).
outputs/public/cohort_half_life_summary.jsonFirst-year activation and scan benchmarks
Approximately 48% of dynamic QR codes are scanned at least once in their first year— a stable figure across the registered-account analysis (H1 2024 creation cohort, 12-month observation). Roughly half of created codes never generate a scan. This is consistent with patterns seen in other one-to-many physical deployment scenarios — print runs, packaging, signage — where some units are never encountered by a scanner.
Among the codes that do get scanned (the "ever-scanned" cohort, registered accounts), first-year scan benchmarks are as follows:
- 25th percentile (p25): 2 scans in the first year
- Median (p50): 5 scans in the first year
- 75th percentile (p75): 21 scans in the first year
- 90th percentile (p90): 98 scans — approximately 20× the median
Website URL codes (the largest category) show a slightly higher median of 7 scans in the ever-scanned group. These figures are for registered accounts, H1 2024 creation cohort, 12-month observation window. Never-scanned codes are excluded from the median-of-scanned figures; including all codes, the median falls to zero.
Lifecycle archetypes: four patterns of QR use
Cluster analysis of registered-account QR codes reveals four recurring lifecycle patterns:
- Evergreen: Codes that generate consistent scans month after month — typically long-running campaigns, permanent signage, or recurring-use contexts (menus, product packaging, WiFi codes). Fewer than 3 in 10 registered codes by count, but earn approximately 74% of first-year scans in the registered cohort.
- Event/campaign spikes: Codes with a concentrated burst of scans around a specific event or campaign window, then near-zero activity. Common in print campaigns, events, and seasonal promotions.
- Slow starters: Codes with delayed peak scan activity — consistent with a print-and-deploy lead time before physical assets reach consumers.
- One-and-done: Codes scanned only once or a very small number of times, then idle. Often a single-use test or a low-distribution print scenario.
Platform-wide (including anonymous codes), evergreen codes are fewer than 1 in 10 by count but earn roughly two-thirds of all first-year scans. The contrast with the registered scope (3 in 10, 74% of scans) quantifies the professionalisation gap between registered and anonymous/casual use.



 English (US)
 Spanish (ES)
 French (FR)