


16-Year QR Code Scan Trends: 2009–2025
From 5,813 scans in 2009 to 88.2 million in 2025: a 16-year arc that defines QR as established infrastructure — not a pandemic fad.
QR codes: from novelty to infrastructure
QRStuff's dynamic scan dataset begins in 2009 — the earliest year in a continuous scan log that extends through the end of 2025. That 16-year span contains the full story of QR in modern markets: a specialist tool in the late 2000s, a mainstream consumer behaviour after 2018, an acceleration during the pandemic, and a normalisation after the 2024 peak. [1]
The long arc matters for framing. Dynamic scans reached 88,206,725 in 2025, down 12.2% from the record 100,470,117 in 2024. Taking a longer view, 2025 volume remains 2.7× above the 2018–2019 pre-pandemic average. The compound annual growth rate from 2018 (the last full year before pandemic disruption) to 2025 is 16.1%. These figures use aggregate hit counts. Bot/prefetch methodology has been reviewed and approved (2026-06-12).
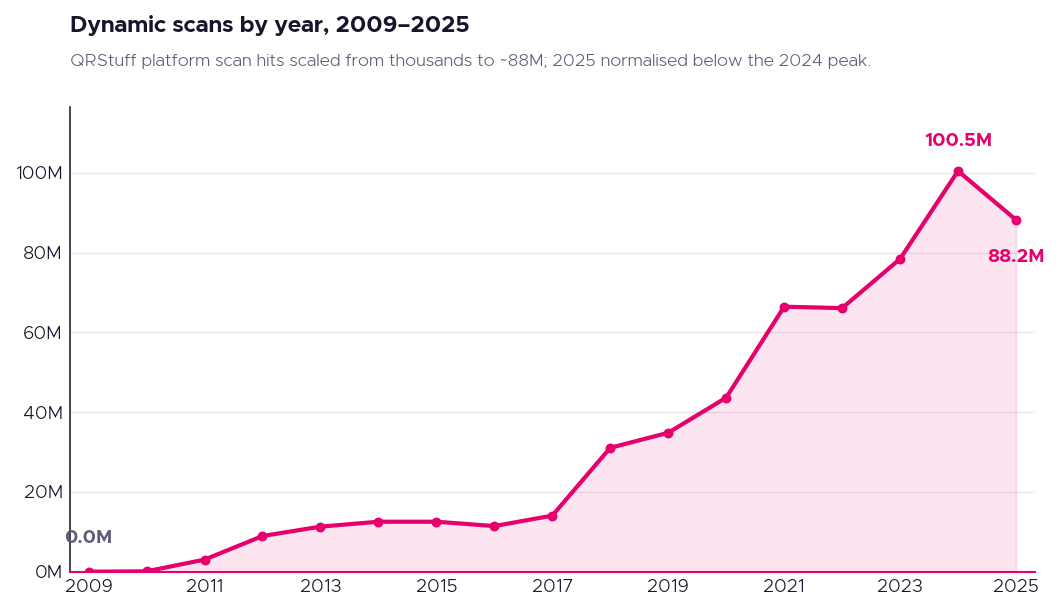
outputs/public/scan_trend_long_term.jsonAnnual scan volumes — the full table
All figures are aggregate hit counts. Source: QRStuff platform data.
| Year | Dynamic Scans | YoY Change |
|---|---|---|
| 2009 | 5,813 | — |
| 2010 | 96,294 | ▲ +1,557% |
| 2011 | 3,027,062 | ▲ +3,043% |
| 2012 | 8,946,777 | ▲ +196% |
| 2013 | 11,301,811 | ▲ +26% |
| 2014 | 12,529,882 | ▲ +11% |
| 2015 | 12,534,841 | +0% |
| 2016 | 11,443,391 | ▼ −9% |
| 2017 | 14,063,923 | ▲ +23% |
| 2018 | 31,066,611 | ▲ +121% |
| 2019 | 34,832,260 | ▲ +12% |
| 2020 | 43,642,353 | ▲ +25% |
| 2021 | 66,436,944 | ▲ +52% |
| 2022 | 66,088,691 | ▼ −1% |
| 2023 | 78,425,949 | ▲ +19% |
| 2024 | 100,470,117 | ▲ +28% |
| 2025 | 88,206,725 | ▼ −12.2% |
Maturity, not collapse
The approved editorial framing for the 2024→2025 decline is normalisation, not collapse. The 12.2% year-over-year drop follows an unusually strong 2024 peak (+28% vs 2023). Two important context points from the quarterly breakdown: the decline was front-loaded (H1 2025 fell 20.7% year-over-year while H2 fell just 2.5%), and Q4 2025 was the only quarter to grow year-over-year at +10.6%.
Q4 2025 scan growth year-over-year — the only quarter in 2025 to post positive growth, suggesting platform stabilisation after the first-half correction.
Source: QRStuff platform data. QR code creation followed a similar pattern: new code creation on the QRStuff platform fell 33.4% from 2,105,020 codes in 2024 to 1,402,449 in 2025 (Visualead-linked accounts excluded from both figures). A maturing installed base of existing dynamic codes continues to generate scans even as net new creation slows — captured by the 62.9 scans-per-new-code ratio in 2025, up from lower ratios in prior years.
Seventeen years of QR product evolution
Scan volume is only one longitudinal lens. Creation-year extracts (2009–2025, ex-Visualead) show how the product mixchanged: website URL codes still dominate, but WiFi, vCard, plain text, PDF, and form types grew share over time. Dynamic (tracked short-URL) codes became the majority of new creations — QR shifted from static encoded payloads toward updatable, measurable destinations.
Milestone-year geography panels (2012, 2016, 2020, 2022, 2025) show scan share gradually shifting east: the United States remains #1 throughout, but India, Indonesia, and broader Asia-Pacific gain visible weight in the 2020s — the same pattern visible in the full-year 2024→2025 rank-change data. Source files: data_type_mix_by_year.json, dynamic_static_split_by_year.json, and geography_country_top15_{year}_full_year.json.
Notes
- Basis for the 16-year / longest-running dataset claim. QRStuff (qrstuff.com) has been continuously operated by QR Code Generator Inc. since approximately 2008–2009; the scan record in this report begins with 5,813 dynamic scans in 2009 and runs without interruption through 2025. For comparison, Uniqode (formerly Beaconstac) launched circa 2013 and published its first multi-year scan series in 2025 covering calendar year 2024; QR Tiger launched circa 2012 but does not appear to publish a continuous longitudinal scan series; Bitly's QR code scan tracking began circa 2020. The claim is specifically that this is one of the longest-running continuously operated, single-platform, first-party QR code scan datasets — not a claim about total scan volume or global coverage. To our knowledge, no other QR code platform has published a comparable longitudinal record beginning earlier than 2013. If you are aware of a longer-running comparable dataset, we welcome correction at research@qrstuff.com. ↩
Methodology note: claim basis and limitations
The "longest-running" qualifier is based on publicly available competitor company histories and published industry reports. It has not been independently verified by a third party. Early years carry very low absolute volumes (5,813 scans in 2009; 96,294 in 2010) — the claim refers to the span of the continuous record, not its size. Bot/prefetch methodology has been reviewed and approved (2026-06-12); see the full methodology in the report hub. The claim is stated as "to our knowledge" throughout the report and does not depend on scan totals being final.




 English (US)
 Spanish (ES)
 French (FR)