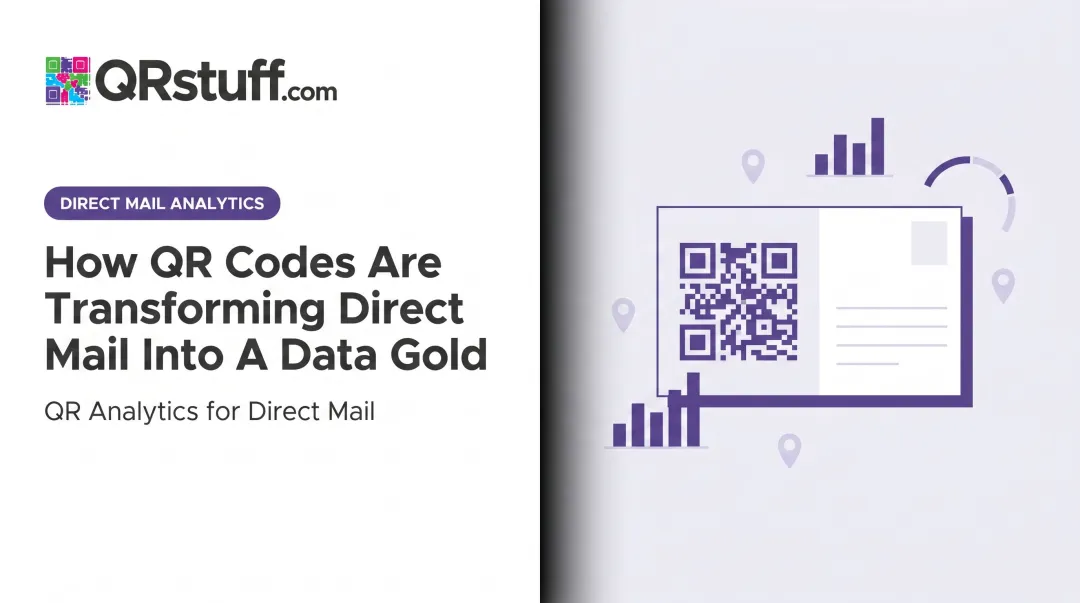
Introduction
Print campaigns, packaging inserts, event signage, out-of-home advertising — marketers pour significant budget into physical channels and then struggle to prove what any of it actually did. U.S. out-of-home advertising revenue surpassed $9.1 billion in 2024, yet measuring whether those placements drive real engagement remains one of marketing's most persistent challenges.
QR code tracking closes that gap. Every scan converts a physical interaction into a measurable data point: who engaged, on what device, from where, and when. That makes offline marketing as accountable as any digital channel.
This article covers what QR code tracking is, which metrics it captures, how it strengthens your marketing analytics setup, and how to deploy it in real campaigns.
Key Takeaways
- Only dynamic QR codes support tracking — static codes produce zero scan data
- QR scan data reveals audience location, device type, and timing patterns that print channels normally hide
- Appending UTM parameters to destination URLs bridges QR scan data with Google Analytics for full-funnel attribution
- Dynamic codes let you update the destination URL after printing, so analytics feed directly into campaign decisions without reprinting
What Is QR Code Tracking and How Does It Work?
When a user scans a dynamic QR code, their device doesn't go directly to your destination URL. It first contacts a short redirect URL hosted by the QR platform. That redirect layer logs the scan event — recording time, location, device, and operating system — before forwarding the user to the final destination. The whole process is invisible to the user and takes milliseconds.
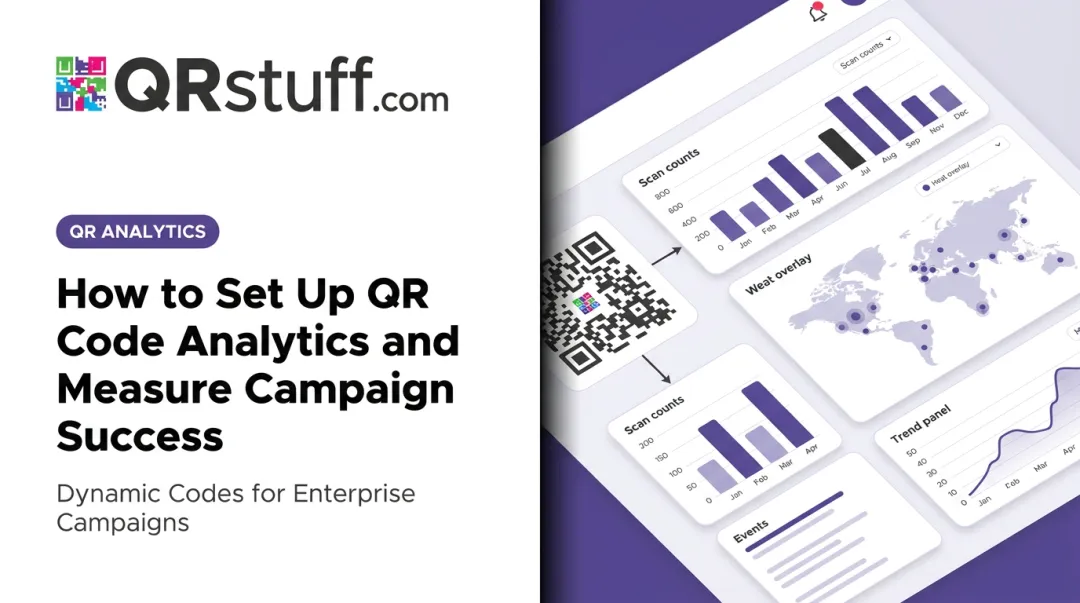
QRStuff's analytics dashboard surfaces this data in real time. As soon as a dynamic code is scanned, scan information populates in the dashboard, giving marketers up-to-the-minute visibility rather than a post-campaign summary.
Why Static QR Codes Cannot Be Tracked
Static QR codes encode the destination URL directly into the physical pattern of the code itself. There is no redirect layer, no server event, and therefore no data recorded.
According to Bitly, static QR codes store fixed information with no ability to track scans or modify the destination after creation.
If you print 10,000 flyers with a static QR code, you have no way to know how many people scanned it, where they were, or what device they used — and you can't update the destination if the campaign changes.
Dynamic codes address both of these gaps. The destination is managed server-side — changeable at any time without reprinting — and every scan is captured as a distinct data event.
Static codes work fine for permanent, non-analytics use cases. For any campaign where performance measurement matters, dynamic codes are the only viable option.
Key Metrics QR Code Tracking Captures for Marketers
QR scan data goes well beyond a simple scan count. Here's what platforms like QRStuff capture for every dynamic code:
| Metric | What It Tells You |
|---|---|
| Total scans | Overall engagement volume across the campaign |
| Unique scans | Distinct individuals who engaged — true audience reach |
| Geographic data (city & country) | Which regions and markets are most responsive |
| Device type & OS (iOS/Android) | Informs landing page optimization and app store routing |
| Time of scan (by hour, day, week) | Reveals peak engagement windows for campaign timing |
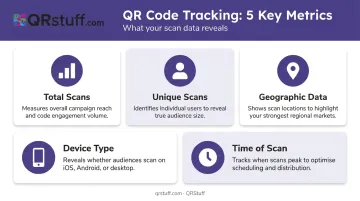
How Each Metric Drives Decisions
Total and unique scans measure different things. If a code records 500 total scans but only 120 unique scans, a small group is engaging repeatedly — that's a signal to investigate placement quality before calling the campaign a win.
City- and country-level geographic data makes uneven performance visible. A billboard campaign spread across five cities suddenly shows you which markets are responding — and gives you a reason to shift budget rather than guessing.
Device breakdown goes beyond landing page design. If scan data shows a majority of iOS users, route them directly to the App Store listing; Android-heavy audiences go to Google Play. One QR code, two destination paths tailored to each audience.
Time-based scan patterns show exactly when your audience engages with physical media. Scans spiking between 12–2pm on weekdays? A complementary email or paid social push timed to that window multiplies the impact of what's already working.
How QR Code Tracking Strengthens Marketing Analytics
Offline-to-Online Attribution
QR codes are one of the few tools that connect a physical interaction directly to an online event. A billboard scan, a product package tap, a flyer pickup — each produces a traceable session rather than an unaccountable impression. For channels that have historically been justified on reach alone, that's a meaningful shift.
UTM Parameters and Google Analytics Integration
The most powerful setup combines QR scan data with web analytics. Appending UTM parameters to the destination URL before creating the code means Google Analytics' Campaign URL Builder logs every QR-driven visit as a distinct traffic source, with campaign source, medium, name, and content all preserved.
A properly tagged URL looks like this:
https://yoursite.com/landing-page?utm_source=retail-signage&utm_medium=qr-code&utm_campaign=summer-promo&utm_content=endcap-placement
QRStuff supports UTM parameters natively. Add them to the destination URL before generating the code and both the QRStuff dashboard and Google Analytics capture the traffic independently.
A/B Testing Physical Placements
Deploy separate dynamic QR codes across different physical placements, each pointing to the same destination URL:
- Shelf display
- Window signage
- Direct mail insert
Compare scan volumes across codes to identify which placement is actually driving traffic. That level of controlled comparison has never been possible with traditional print — and it feeds directly into ROI measurement.
Campaign ROI Measurement
Scan data connects to destination page performance. With UTM-tagged URLs, you can trace the full funnel:
Physical impression → scan → landing page visit → conversion
That chain produces ROI calculations that justify physical marketing spend with the same rigor applied to paid digital.

Setting Up QR Code Tracking: A Step-by-Step Overview
Step 1: Create a Dynamic QR Code with Built-In Analytics
Choose a platform that captures scan data natively. QRStuff records total and unique scans, geographic data at city and country level, device and OS breakdowns, and time-based scan patterns — all visible in a real-time dashboard. Generate a dynamic code pointing to your intended destination.
Step 2: Append UTM Parameters to the Destination URL
Before generating the code, add UTM parameters to the destination URL. Key parameters to include:
utm_source— identifies the traffic origin (for example, "print" or "poster")utm_medium— defines the channel (for example, "qr_code")utm_campaign— ties scans to a specific campaign nameutm_content— optional, but useful for differentiating placements
This ensures both the QR platform dashboard and Google Analytics attribute traffic correctly from the moment the first scan occurs.
Step 3: Deploy, Monitor, and Course-Correct
Launch the campaign, then check the analytics dashboard within the first 24–72 hours. Confirm scans are recording, look for geographic or device anomalies, and course-correct before the campaign peaks. If engagement is low or a landing page error appears, update the destination URL in the QRStuff dashboard instantly — no reprinting required.
Real-World Examples of QR Code Tracking in Marketing Campaigns
These use cases show how per-placement scan data turns physical touchpoints into measurable channels.
Retail and In-Store Promotions
A retailer places unique dynamic QR codes on shelf displays, end-caps, and window signage. Scan location and time data quickly reveals which placement drives the most traffic to a promotional page. Rather than spreading in-store budget evenly, the team concentrates investment on the spots that are actually performing — a budget decision that wouldn't be possible without per-placement tracking.
Product Packaging and CPG Campaigns
Brands embed dynamic QR codes on packaging to link consumers to recipes, tutorials, or loyalty programs. Scan data reveals device type, location, and time of day, showing when and where consumers engage post-purchase. That data informs follow-up digital campaigns and helps personalize offers based on real usage patterns.
Yeo Valley Organic demonstrated a related benefit: connected packaging with QR codes allowed remote marketing-message updates without reprinting packaging.
Event Marketing and Conferences
Event teams assign unique QR codes to different collateral — badge lanyards, booth signage, printed programs. Comparing scan volumes across materials identifies which assets generated the most engagement, giving organizers measurable evidence to justify future event spend and refine which content resonates with attendees.
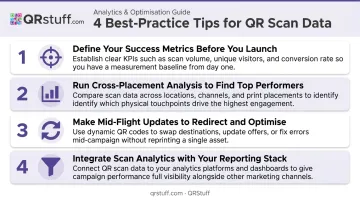
Tips for Making the Most of Your QR Code Scan Data
Before launch, define your success metrics — target unique scans per placement, geographic reach goals, or a downstream conversion rate from QR-sourced traffic. Without a benchmark, you have no way to judge whether results are strong or worth acting on.
Run cross-placement analysis, not single-code reporting. The most useful insight comes from comparing codes against each other — which location outperformed, which time window spiked, which audience segment over-indexed.
Use scan data to fix campaigns mid-flight. Dynamic codes let you swap the destination URL when engagement drops — redirect to a higher-converting offer without touching the printed material.
Pull scan data into your existing reporting stack. QRStuff supports CSV export across plans and API access on Enterprise, so scan data can feed directly into BI tools or layer with Google Analytics for unified cross-channel reporting.
Frequently Asked Questions
How can I track a QR code?
Tracking requires a dynamic QR code created through a platform with built-in analytics. Every scan routes through a redirect that records scan count, location, device, and time — all accessible via the platform dashboard. Static QR codes cannot be tracked.
Does Bitly provide QR code tracking?
Bitly offers QR tracking for dynamic codes on paid plans, with data history ranging from 30 days on the Core plan to two years on Enterprise. City-level geographic data and device breakdowns are available on Premium and above. Platforms like QRStuff provide similar depth — real-time scan data, device breakdowns, and geographic reporting — across plans starting at £4/month, so compare analytics tiers against what your reporting actually needs.
What is the response rate for QR code surveys?
A 2024 survey-methods experiment found QR-code mail invitations delivered an 8.31% response rate versus 7.00% for URL-only — a modest 1.3 percentage point lift. Treat this as a directional benchmark; actual rates vary significantly by audience, placement context, and incentive offered.
Can static QR codes be tracked?
No. Static codes encode the destination directly into the code pattern with no redirect layer, so no scan event is ever recorded. Dynamic QR codes are required to capture any analytics.
What data does QR code tracking collect?
Core data points typically include total scans, unique scans, scan location by city and country, device and OS type, and scan time. The specific data available depends on the platform and subscription tier.
How do I connect QR code tracking data to Google Analytics?
Add UTM parameters to the destination URL before creating the QR code. Google Analytics then logs each QR-driven visit as a distinct traffic source, allowing you to view QR-sourced sessions, goal completions, and conversions alongside all other channel data.