The gap is almost always a setup problem. Dynamic codes weren't used, UTM parameters were skipped, no conversion event was configured, and now there's no way to attribute results or justify the spend. According to Bitly's 2025 report, 87% of marketers identify understanding the post-scan customer journey as their primary ROI challenge — and most of that difficulty is avoidable with the right setup from day one.
This guide covers exactly what to configure before printing, how to connect QR scan data to Google Analytics 4, which metrics actually indicate success, and the mistakes that quietly destroy campaign data.
Key Takeaways
- Dynamic QR codes are required — static codes cannot capture scan data
- UTM parameters connect scan events to GA4 — without them, QR traffic shows up as "direct"
- Track total scans, unique scans, geographic data, device type, and conversions — not just raw scan counts
- Test on at least three device types before printing anything
- Define your conversion benchmark before launch, not after
Why QR Code Analytics Are Non-Negotiable
A static QR code is a dead end for measurement. It encodes the destination URL directly into the code's pattern, so when someone scans it, the visit goes straight to your website with no intermediary event logged, no metadata captured, no record of device or location.
Dynamic QR codes work differently. They route every scan through a short redirect URL — that redirect is where the analytics happen. Each scan is logged as a structured event with a timestamp, device type, operating system, and geographic location before the user ever reaches your destination page. QR-Code-Generator's tracking guide confirms dynamic codes can report total scans, unique scans per device, OS, city/country, and time — none of which static codes can provide.
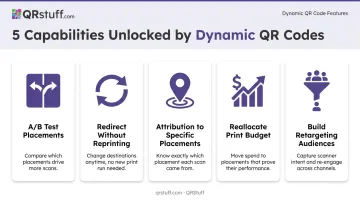
What this data makes possible:
- A/B test physical placements to pinpoint which locations drive the most scans
- Redirect to updated content mid-campaign without reprinting
- Attribute post-scan conversions back to specific placements
- Identify high-performing locations and reallocate print budget accordingly
- Build an audience of engaged scanners for retargeting
The QR codes market reached USD 13.04 billion in 2025, with dynamic codes holding 64.92% of format revenue — that split reflects exactly how the market has aligned around measurability as a core requirement.
What to Prepare Before Setup
Preparation determines analytics quality. Gaps here create incomplete data and broken attribution later in your reporting.
Platform Requirements
You need two things on the platform side:
A dynamic QR code platform with a built-in analytics dashboard that captures scan-level events: real-time tracking, geographic data, device breakdowns, and unique scan identification. QRStuff captures all of these fields out of the box (country, city, device type, OS, timestamp, total and unique scans) and is GDPR compliant with data processed on European servers.
A GA4 account with the ability to create UTM parameters — the tags that connect individual scan events to campaign-level reporting in GA4, so you can see post-scan behavior alongside scan volume.
Campaign Requirements
Before generating a single QR code, define:
- Campaign name — use the same value across every code in the campaign
- Placement — where the code will appear (in-store poster, direct mail, product packaging, event signage)
- Destination URL — the specific page this code leads to
- Conversion action — what counts as success: form submission, product page visit, purchase, or download
Also establish a naming convention for all codes. A format like CAMPAIGN_PLACEMENT_DATE_VARIANT lets your dashboard group and filter results meaningfully across placements. QRStuff supports campaign tagging directly in the platform, letting you assign tags and organize codes by project — scan data stays filterable by campaign even before GA4 receives a visit.
How to Set Up QR Code Analytics: Step by Step
Step 1: Generate a Dynamic QR Code With a Trackable URL
Log into your QR platform, create a new code, and select dynamic — this is the only code type that logs scan events and allows destination editing after printing.
Build your destination URL with UTM parameters appended before you generate the code:
| Parameter | Purpose | Example Value |
|---|---|---|
utm_source |
Specific placement or print source | store_poster, direct_mail |
utm_medium |
Channel type | qr, print_qr |
utm_campaign |
Campaign or offer name | summer_sale_2025 |
utm_content |
Creative variant | poster_a, flyer_back |
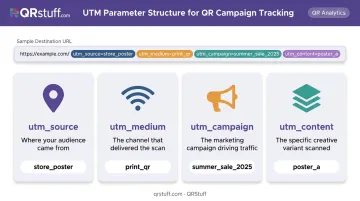
Google's campaign parameter documentation confirms these values appear in GA4's Traffic Acquisition report under Session source/medium and Session campaign dimensions.
UTM values are case-sensitive: QR and qr will appear as separate sources in your reports, so pick a convention and apply it consistently.
Assign a campaign tag in the QR platform itself so scan-level data (device, location, timestamp) is organized for filtering, separate from the GA4 session data.
Step 2: Link to an Optimised Landing Page and Configure a Conversion Event
The majority of QR scans come from mobile devices, so your landing page must be fast. Google's mobile performance data shows 53% of visits are abandoned when pages take more than 3 seconds to load — that's more than half your scan-sourced traffic gone before the page renders.
Before deploying, confirm:
- The landing page loads in under 3 seconds on mobile
- A conversion event is configured in GA4 (form submission, button click, purchase)
- The conversion event fires correctly in a test environment
Without a conversion event, you can measure scan volume but not campaign success.
Step 3: Verify GA4 Is Receiving Tagged Traffic
Do a live test scan, then check GA4's real-time report. You should see a session attributed to the UTM source and medium you configured. If the session shows as (direct) / (none), the UTM parameters are not persisting through the redirect — troubleshoot before printing.
Cross-reference two data sources once live:
- GA4 Acquisition reports for campaign-level session and conversion data
- QR platform native dashboard for scan-level metadata (device type, geographic data, unique vs. total scans) that GA4 does not capture independently
QRStuff's connection to GA4 works via UTM parameter passthrough. The platform does not have a native GA4 connector, but UTM values persist through the redirect and populate correctly in GA4's acquisition dimensions.
Step 4: Test Across Multiple Devices Before Printing
Once GA4 is confirmed receiving data, scan the code on at least:
- An iOS device
- An Android device
- A desktop QR reader
On each device, confirm:
- The redirect goes to the correct URL
- UTM parameters appear in the destination URL
- The conversion event fires on the landing page
Then check the platform dashboard to verify test scans appear with full metadata (location, device type, OS).
A QR code that breaks on one operating system, or a landing page that fails on mobile, can invalidate an entire print run. Unlike a digital ad, you cannot fix a printed QR code after distribution without reprinting.
Step 5: Deploy and Monitor Early
Check your analytics dashboard within the first 24–48 hours of deployment. Early anomalies (zero scans in a region where codes were distributed, or redirect failures) are far easier to correct before a campaign runs its full course.
Set up alerts for significant scan volume changes where your platform supports it. QRStuff offers webhook support for scan events via its API, which can be used to build custom notification triggers for scan spikes or drops without requiring manual dashboard monitoring.
Key Metrics That Determine Campaign Success
Raw scan counts are a starting point. Each metric below answers a specific campaign question.
Total Scans vs. Unique Scans
- Total scans count every scan event, including repeat scans from the same device — indicates overall reach and repeat interest
- Unique scans count distinct devices — gives a more accurate measure of actual audience size
A high total-to-unique ratio signals repeat engagement or strong intent. A ratio close to 1:1 suggests broad reach without return visits. Both patterns inform how to follow up.
Geographic and Time-Based Data
- Geographic data (city, region, country level) shows which physical placements drove the most engagement — use this to reallocate print budget toward high-performing locations
- Time and date data reveals peak scan windows — align follow-up outreach or retargeting pushes to when your audience is most active
QRStuff provides geographic tracking at country, state/region, and city levels on its Full Suite and Enterprise plans. Lite Suite includes limited analytics with a 200 monthly scan cap.
Device and OS Breakdown
Device and OS data tells you whether your audience is primarily iOS or Android, mobile or desktop. This should directly shape landing page design and load time priorities. If 90%+ of your scans come from iOS, for example, that's a clear signal to prioritize Safari rendering and App Store deep-link strategies.
Scan-to-Conversion Rate
This is the metric that actually measures campaign success:
Scan-to-conversion rate = conversions from QR sessions ÷ unique QR scans
A high scan count with near-zero conversions points to a landing page or offer problem, not a placement problem. Establish this target before launch, not after, so you have a real benchmark to measure against rather than a number to rationalize.
The Target Internet MDL Marinas case study offers a concrete benchmark: placement-specific scan rates ran between 7–12% depending on location prominence, generating 900 email registrations in three weeks from QR codes in physical welcome packs.
Build your own campaign-specific baseline rather than borrowing vendor benchmarks. Public conversion benchmarks for print QR campaigns are not reliable enough to use as targets.
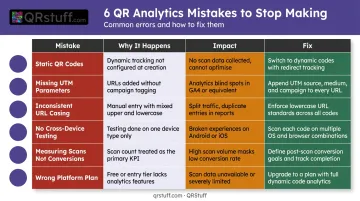
Common Mistakes That Silently Ruin QR Analytics
Most QR analytics problems don't announce themselves — they show up weeks later when the data is fragmented, missing, or meaningless. These six mistakes are the most common culprits.
| Mistake | Why It Happens | Impact | Fix |
|---|---|---|---|
| Using static codes | Looks the same as dynamic | Zero scan metadata, no redirect control | Always verify code type before printing |
| Skipping UTM parameters | Seems optional | QR traffic appears as (direct) in GA4 |
Tag every destination URL before generating the code |
| Inconsistent UTM casing | No naming convention | qr, QR, and Qr fragment into separate sources |
Use lowercase, document the convention |
| Not testing across devices | Tested on one phone | Broken redirects on one OS invalidates print run | Test iOS, Android, and desktop before printing |
| Measuring scans, not conversions | Scan volume looks like success | High-traffic, low-ROI campaigns look fine until budget review | Define conversion event before launch |
| Wrong platform plan | Checked features, not data retention | Analytics data expires before campaign ends | Confirm scan retention, export options, and dynamic code limits before committing |
The costliest mistake on this list is the last one — discovering your plan's scan history expires mid-campaign means you're making budget decisions on incomplete data.
Frequently Asked Questions
How do you track analytics from a QR code?
Tracking requires a dynamic QR code, which routes each scan through a short redirect URL that logs the scan event — including device type, location, and timestamp — before sending the user onward. Appending UTM parameters to the destination URL connects those scan events to your GA4 campaign reports.
What is the difference between total scans and unique scans?
Total scans count every scan event, including multiple scans from the same device. Unique scans count distinct devices. For measuring actual audience size, unique scans are the more reliable figure — total scans are better for gauging repeat engagement and overall interest volume.
Can I integrate QR code analytics with Google Analytics 4?
Yes. Append UTM parameters (utm_source, utm_medium, utm_campaign) to the destination URL and every scan that reaches your landing page is attributed to the correct campaign in GA4's Acquisition reports. QRStuff passes these parameters through its redirect, keeping attribution data intact.
Do I need a paid plan to access QR code analytics?
Most platforms restrict full analytics to paid tiers. QRStuff's Free Suite supports up to 50 scans/month on 10 dynamic codes, while paid plans starting at $8/month add scan location, device type, GPS data, and Google Analytics integration with higher or unlimited scan caps.
How do I know if my QR code campaign is successful?
Define success before launch — specifically, set a target scan-to-conversion rate, not just a scan count. A successful campaign shows meaningful conversion actions (purchases, sign-ups, downloads) attributable to QR-sourced traffic, with scan-to-conversion rates holding steady or improving across placements over the campaign's run.
Can a QR code link to multiple destinations?
A static code encodes one fixed URL and cannot change. Dynamic QR codes can point to a new destination at any time without reprinting. Some platforms also support conditional redirects; QRStuff automatically routes iOS users to the App Store and Android users to Google Play when the App data type is selected.