A poorly sized code fails to scan. A static code locks you into a destination you can't change. A screen-displayed code with no tracking is a guess. Getting it right means making deliberate choices at every step: code type, design, placement, and ongoing optimisation.
This guide walks through exactly how to create, track, and optimise QR codes for digital signage — covering the most common mistakes that quietly kill scan rates along the way.
Key Takeaways
- Dynamic QR codes are essential for digital signage — update destination content any time without touching the on-screen graphic
- Size and contrast matter more on screens than in print — test on the actual display before going live
- Scan analytics reveal what's working — track volume, timing, device type, and location across your display network
- Optimization is ongoing — adjust placement, CTA copy, and content based on real scan data
- Three mistakes cause most QR failures: skipping the live test, linking to slow pages, or using a static code for changing content
How to Create a QR Code for Digital Signage
Creating an effective QR code for a digital display isn't just generating an image — it requires deliberate decisions about content type, code format, and display compatibility before anything hits the screen.
Step 1: Define Your Content Destination and Code Type
Start with the action you want viewers to take. Common destinations for digital signage include:
- Landing pages or promotional URLs — the most versatile option for most signage contexts
- PDF menus or documents — ideal for restaurants and hospitality displays
- Video content — effective for product showcases or event promotions
- Event registration forms — useful in corporate lobbies and campus environments
- WiFi login credentials — common in hotels, cafés, and conference spaces
- Feedback forms or check-in flows — used in healthcare, retail, and corporate office signage
QRStuff supports 40+ QR code data types, giving operators flexibility to match the code to the specific campaign goal rather than defaulting to a generic URL every time.
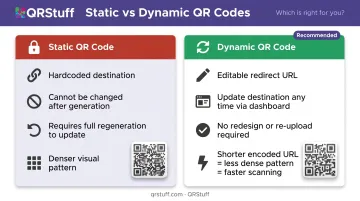
Step 2: Choose Dynamic Over Static
This is the most consequential decision for any digital signage deployment.
Static QR codes hardcode the destination directly into the visual pattern. Once generated, they cannot be changed. Dynamic QR codes encode a short redirect URL instead; the actual destination lives in the platform dashboard and can be updated any time without regenerating the code image.
For digital signage, dynamic codes are the correct default. Here's why:
- Content rotates and promotions expire — a dynamic code lets you swap destinations without touching the on-screen graphic
- No redesign, re-upload, or re-test required when campaigns change
- Shorter encoded URLs produce a less dense visual pattern, making the code faster and easier for phones to scan
Step 3: Generate and Customize the Code
Once you've selected the destination and chosen dynamic format, customize the visual elements for screen display:
- Foreground and background color — high contrast is critical
- Logo overlay — QRStuff automatically raises the error correction level when a logo is added, keeping the code scannable; a logo can safely cover up to 30% of the code surface
- Module and finder shapes — square, rounded, dot styles are all available on paid plans
- Gradient effects — available as an additional design option for branded signage
Customization options are available on paid tiers. For organisations managing QR codes across a signage network, QRStuff's Full Suite (from £15/month) and Enterprise tier (£185/month) include advanced styling, bulk generation, and multi-code dashboard management.
Step 4: Set Size and Error Correction Level
AVIXA Xchange recommends a minimum of 2 × 2 inches for QR codes on digital signage, with larger sizes for longer viewing distances. When in doubt, go bigger — a code that's too small simply won't scan from a normal standing distance.
For error correction, DENSO Wave's standard defines four levels:
| Level | Recoverable Data | Best For |
|---|---|---|
| L | ~7% | Simple codes, no logo, ideal conditions |
| M | ~15% | General use |
| Q | ~25% | Logo overlays, partial obstruction risk |
| H | ~30% | High-glare environments, significant logo coverage |
For digital signage, Q or H is the safer choice — screen glare, reflections, and logo overlays all reduce scanability, and higher error correction provides a buffer. Note that higher correction increases code density slightly, so always test the final output.
QRStuff automatically selects an appropriate error correction level based on your data type and customization choices, but you can adjust this manually when needed.
Step 5: Test on the Actual Display Before Going Live
Never skip this step. A code that scans cleanly on a laptop preview can fail completely on the real screen due to glare, refresh rate, brightness settings, or display resolution.
Test checklist before deployment:
- Download the code in SVG or high-resolution PNG format — SVG scales without any quality loss, making it the preferred format for digital signage CMS uploads
- Display the code at actual on-screen size
- Scan with both iOS and Android devices using native camera apps
- Test from the actual viewing distance a visitor would stand
- Check under expected lighting conditions (including bright ambient light if relevant)
- Verify the destination loads correctly on mobile — check layout, load speed, and whether the intended action (sign-up, purchase, form completion) is completable without friction
On the mobile destination: Google data shows 53% of mobile visits are abandoned if a page takes longer than 3 seconds to load. A successful scan that leads to a slow page is a wasted opportunity.
How to Track QR Code Performance on Digital Signage
Without tracking, a QR code on a digital sign tells you nothing. Scan analytics change that — every scan becomes evidence of whether your placement, message, and destination are actually working.
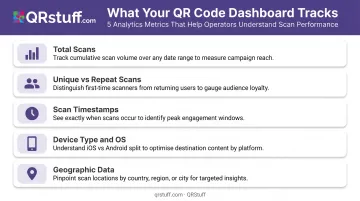
What Metrics to Monitor
QRStuff's real-time analytics dashboard tracks the following for every dynamic QR code:
- Total scans — raw engagement volume
- Unique vs. repeat scans — distinguishes new audience reach from returning scanners
- Scan timestamps — identifies peak engagement hours and days
- Device type and OS — iOS vs. Android breakdown, useful for optimizing the destination page experience
- Geographic data — scan location at country and city level, critical for networks managing codes across multiple display sites
For operators running QR codes across a signage network, location-tagged scan data identifies which physical displays drive the highest engagement — useful for prioritising creative investment and content updates.
How to Access and Use Scan Data
Dynamic QR codes redirect through QRStuff's tracking URL, logging every scan event automatically. No third-party setup is required for this baseline tracking — the dashboard populates in real time as scans occur.
The dashboard gives you several ways to work with that data:
- View scan trends as line or bar charts, filtered by daily, weekly, or custom date ranges
- Export reports as CSV or PDF/Excel for stakeholder presentations or external analysis
- Append UTM parameters to destination URLs so GA4 (or any compatible analytics platform) attributes post-scan behavior back to the specific code and display location
That last point connects the physical scan event to downstream metrics — pages visited, time on site, and goal completions — giving you a full picture of what happens after the scan.
How to Optimise QR Codes for Better Scan Rates
How to Optimize QR Codes for Better Scan Rates
Optimization works as a loop: measure, adjust one variable, measure again. Here's where to focus.
Placement and Visibility
Low scan volume often traces back to placement first. AVIXA Xchange recommends placing the QR code front and centre on the display, away from obstructions and visual distractions. Assess:
- Is the display at eye level or close to it?
- Is the QR code in a screen zone that stays visible throughout the content loop?
- Is it in a high-dwell-time area where viewers have time to stop and scan?
Call-to-Action Copy
A QR code with no instruction underperforms. Pair every code with a clear, specific CTA. Compare:
- Vague: "Scan here"
- Specific: "Scan for today's lunch specials" or "Scan to register for the event"
Test specific CTA variations and compare scan rates before and after changes. Benefit-driven CTAs consistently outperform generic ones — often by a wider margin than any design change.

Content Rotation via Dynamic Codes
Dropping scan rates on a previously strong display usually signal content fatigue. To fix it:
- Swap the destination URL to a new offer, seasonal promotion, or fresh landing page
- Leave the on-screen code unchanged — dynamic codes let you update the destination without reprinting
- Monitor scan volume over the following week to confirm recovery
Time-Based Scheduling
Scan timestamp data reveals peak windows — lunch hours in a restaurant, commute times in a transit hub, morning check-in at a hotel. Once you've identified those windows, adjust your signage content playlist so QR code slides appear more frequently during them.
A/B Testing
Run two design or CTA variants across comparable display locations or time slots — different code colour, different CTA wording, or different graphic layout. Compare scan rates between the two to identify which version performs better, then retire the underperformer.
Key Design Parameters for Screen-Displayed QR Codes
Contrast and Background
High contrast is the single most important visual factor. AVIXA recommends a classic dark code on a solid light background. For practical screen deployment:
- Avoid placing QR codes over video or animated backgrounds — movement makes scanning unreliable
- In high-ambient-light environments (retail storefronts, outdoor kiosks), add a white-bordered quiet zone around the code to separate it from bright surrounding content
- Mid-tone color combinations reduce contrast and should be avoided entirely
DENSO requires a four-module quiet zone on all sides of every QR code. Preserve this margin in your signage layout.
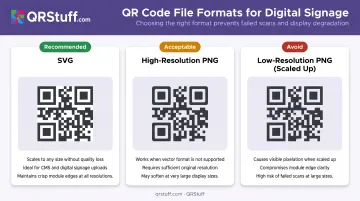
Resolution and File Format
For screen export:
- SVG format is ideal for digital signage CMS uploads — it scales to any display size without pixelation
- High-resolution PNG works for systems that don't support vector formats
- Avoid exporting at screen-preview resolution and scaling up — this introduces pixelation that affects scannability
Viewing Distance and Size
Use AVIXA's 2 × 2 inch minimum as your baseline, then scale up based on your display size and placement. No universal formula maps viewing distance to exact dimensions reliably — the most dependable approach is to test the code on the actual screen, from where viewers will stand, using representative smartphones.
Key testing checkpoints:
- Confirm scannability at maximum expected viewing distance before finalizing layout
- Test with both iOS and Android cameras, as scan performance can differ between devices
- Re-test any time you change screen brightness, content layout, or QR code size
Common Mistakes When Adding QR Codes to Digital Signs
Three mistakes consistently undercut QR code performance on digital signs:
Skipping the live display test. A code that scans perfectly on a monitor can fail on the actual screen due to glare, refresh rate, or brightness settings. Test on the real hardware before launch — every time.
Sending users to a non-mobile-optimized destination. The scan is just the beginning. If the destination is slow, hard to navigate, or not formatted for small screens, the engagement is lost the moment the page loads. Test every URL on multiple mobile devices, confirm load time, and verify the intended action is completable on a phone.
Using a static code for changeable content. Static codes lock the destination permanently. Every update requires regenerating the image, re-uploading it to the CMS, and re-testing. For any deployment where content changes — which covers most signage — dynamic codes are the right choice from the start.
Frequently Asked Questions
Do QR codes work on digital screens?
Yes. QR codes work reliably on digital screens when set up correctly. Scannability depends on screen brightness, display resolution, adequate code size, and sufficient contrast between the code and its background. Testing on the actual display before going live is essential.
What size should a QR code be on a digital sign?
AVIXA recommends a minimum of 2 × 2 inches as a starting point, with larger sizes for displays viewed from greater distances. When in doubt, go bigger: a code that's too large loses nothing, while one that's too small won't scan.
What's the difference between a static and dynamic QR code for digital signage?
Static codes permanently encode the destination and can't be changed after generation. Dynamic codes use an editable redirect, so the destination can be updated any time through the dashboard without regenerating or replacing the on-screen code image. Dynamic codes are the standard choice for digital signage.
How do I track how many people scanned my QR code on a digital sign?
Dynamic QR codes automatically log every scan through the QRStuff analytics dashboard, capturing scan counts, unique vs. repeat scans, device types, timestamps, and geographic data at country and city level. No additional setup is required.
Can I update my QR code content without changing the code on my digital sign?
Dynamic QR codes let you change the destination URL or content at any time through the QRStuff dashboard. The code image on screen stays exactly the same: no redesign, no re-upload, no re-testing needed.
How far away can someone scan a QR code on a digital display?
Scan distance depends on code size, screen resolution, contrast, and ambient lighting conditions. No universal maximum exists. Test your code on your actual display at the distances your audience will use, then adjust code size until it scans consistently.