The problem isn't the QR code itself. It's the setup. Measuring ROI requires connecting scan events to conversion actions and revenue outcomes — not just watching a scan counter tick upward.
This guide covers what you need before launching a trackable campaign, a step-by-step ROI measurement process, the four metrics that drive decisions, the mistakes that corrupt your data, and how to optimise after your first run.
Key Takeaways
- QR code ROI means tying scan data to real business outcomes, not raw scan counts.
- Dynamic QR codes are essential — static codes produce no tracking data at all.
- Create one unique code per placement so channel-level attribution is actually possible.
- Core ROI formula: (Revenue Generated − Campaign Cost) ÷ Campaign Cost × 100.
- Track scan-to-conversion rate, cost per acquisition, and revenue per scan to understand what's driving ROI.
What You Need Before You Can Measure QR Code ROI
Measurement accuracy is determined before the campaign launches, not after — these three foundations need to be in place first.
A QR Platform With Built-In Analytics
Free tools that generate static QR codes provide zero post-scan data. Once printed, a static code is a black box — you cannot track scans, update the destination URL, or recover anything if the link breaks.
Dynamic QR codes work differently. They encode a short redirect URL that captures scan events before routing users to the destination. QRStuff's analytics dashboard tracks real-time data across total scans, unique scans, scan velocity by hour, device type, and geographic location down to city level — and that data is the raw material for every ROI calculation.
Plan selection matters here. QRStuff's Full Suite and Enterprise plans include GPS coordinates, time-of-scan recording, and Google Analytics integration. The Lite plan covers basic analytics but caps monthly scans at 200, so any serious campaign tracking requires Full Suite or above.
UTM Parameters and Destination URL Structure
A scan event only tells you someone pointed their camera at a code. UTM parameters tell you what they did next.
Append utm_source, utm_medium, utm_campaign, and utm_content to every QR destination URL. Google Analytics uses these parameters to attribute downstream behaviour — page views, sign-ups, purchases — to the specific campaign and creative that drove the traffic.
QRStuff supports UTM configuration directly within its advanced tracking settings, so you're not manually editing URLs outside the platform. Campaign tagging within QRStuff also lets you organise codes by initiative and filter performance comparisons across placements.
A Defined Conversion Event
ROI is undefined without a measurable outcome. Before any code goes to print, identify:
- The conversion action: purchase, form submission, app install, coupon redemption, or loyalty sign-up
- The monetary value: average order value for direct sales, or lead-to-customer rate × average deal size for lead-gen campaigns
Without a pre-assigned monetary value per conversion, the ROI formula has nothing to calculate.
How to Measure QR Code ROI: Step-by-Step
Follow these six steps for any QR campaign — print ads, product packaging, direct mail, or in-store displays — to get clean, comparable ROI data every time.
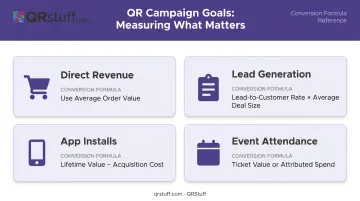
Step 1: Define Your Goal and Assign a Conversion Value
Different goals require different formulas:
- Direct revenue (e-commerce purchase) → use average order value
- Lead generation (form fill) → use (lead-to-customer rate × average deal size)
- App installs → use lifetime value per install minus acquisition cost
- Event attendance → use ticket value or attributed spend per attendee
Assign the value before launch. Assigning it after the fact introduces estimation errors.
Step 2: Create One Unique Dynamic Code Per Placement
Using a single QR code across a billboard, mailer, shelf talker, and packaging makes channel attribution impossible. Every placement needs its own code.
QRStuff supports multiple unique dynamic QR codes per campaign, each with independent scan tracking. This means you can compare a direct mail piece against an in-store display side by side, with no data blending.
Dynamic codes also protect ROI from a specific failure mode: broken destination links. If a URL changes mid-campaign, you can update the destination without reprinting — keeping every placement live and converting.
Step 3: Configure Tracking Before Anything Goes to Print
- Append UTM parameters to the destination URL for each code
- Configure a conversion goal or key event in Google Analytics (or your analytics platform of choice)
- Test every code on iOS, Android, and a desktop QR reader before finalising print files
One broken code in a batch of ten wastes 10% of your campaign spend before a single customer sees it.
Step 4: Monitor Scan Data Throughout the Campaign
Use QRStuff's real-time dashboard to track:
- Total scans vs. unique scans
- Geographic distribution and top-performing cities
- Device type breakdown (mobile dominates — QRStuff's data shows 92% of scans come from mobile users in typical campaigns)
- Peak scan times by hour or day
Review cadence: weekly for campaigns under four weeks; bi-weekly for longer runs. Watch for early warning signs: low unique scans or unexpected geographic concentration. These indicate placement or targeting problems you can correct before committing significant budget.
Step 5: Calculate ROI Using the Correct Formula
For direct revenue campaigns:
ROI (%) = [(Revenue Generated − Total Campaign Cost) ÷ Total Campaign Cost] × 100
Total Campaign Cost includes:
- QR platform subscription (e.g., QRStuff Full Suite at £15/month)
- Design and creative fees
- Printing and production
- Distribution costs
- Any paid promotion
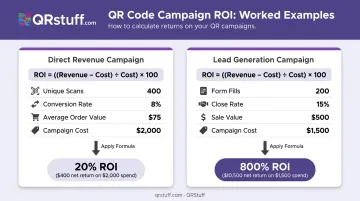
Worked example: A retail brand runs a packaging QR campaign. Total campaign cost: $2,000. The QR code drives 400 unique scans. Scan-to-conversion rate: 8%. Average order value: $75. Revenue attributed: 400 × 0.08 × $75 = $2,400.
ROI = [($2,400 − $2,000) ÷ $2,000] × 100 = 20%
For lead generation campaigns:
ROI (%) = [(Leads × Lead-to-Customer Rate × Average Sale Value) − Campaign Cost] ÷ Campaign Cost × 100
Worked example: 200 form submissions, 15% close rate, $500 average sale value. Campaign cost: $1,500.
ROI = [(200 × 0.15 × $500) − $1,500] ÷ $1,500 × 100 = [(15,000 − 1,500) ÷ 1,500] × 100 = 800%
Step 6: Document Results and Build Benchmarks
Track every campaign consistently so your data compounds into something useful. For each campaign, record:
- ROI by channel (e.g., direct mail vs. in-store display)
- ROI by individual placement within each channel
- Scan-to-conversion rate and average order value
After three campaigns, patterns become clear. If in-store shelf codes return 6% ROI and direct mail returns 18%, the budget allocation decision makes itself.
Key Metrics That Determine QR Code ROI
ROI is the bottom line. These four metrics explain what's driving it.
Total Scans vs. Unique Scans
Total scans count every scan event, including repeated scans from the same device. Unique scans count individual devices — one scan per device regardless of how many times that device scanned.
If seven people scan a code and one person scans it twice, you get 8 total scans and 7 unique scans.
Using total scans to estimate audience reach inflates your numbers and distorts cost-per-acquisition figures. Unique scans are the correct denominator for reach-based ROI calculations.
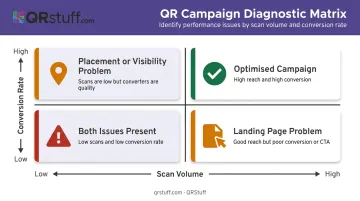
Scan-to-Conversion Rate
The percentage of scans that result in the desired action. This metric separates a QR placement problem from a post-scan experience problem.
- High scans + low conversion rate = landing page issue (speed, relevance, CTA clarity)
- Low scans + high conversion rate = placement or visibility issue
Research across 41,000+ landing pages found a median conversion rate of 6.6% — useful context for the post-scan destination, though QR-specific benchmarks vary by campaign type and industry.
Cost Per Acquisition (CPA)
CPA = Total Campaign Cost ÷ Number of Conversions
This isolates what each conversion actually costs from a specific QR placement, enabling direct comparison against other channels. A QR-driven CPA of $12 against a paid search CPA of $35 for the same conversion is a clear signal on where to scale.
Public QR-specific CPA benchmarks are scarce, so treat your own historical campaign data as the reference point. Track CPA per placement from the start so you have a baseline to compare against.
Revenue Per Scan
Total Revenue Attributed ÷ Total Unique Scans
Revenue per scan cuts through placement comparisons fast. A shelf talker generating $0.85 per scan versus a direct mail piece generating $2.10 per scan tells you exactly where your print budget should shift.
No need to rerun the full ROI formula for each placement — this single figure does the work.
Common Mistakes That Skew QR Code ROI Results
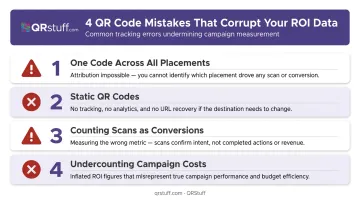
Inaccurate data often does more damage than no data — it directs budget toward underperforming channels with apparent justification. These are the four mistakes that consistently corrupt the numbers:
- One code across all placements: Pooled scan data makes placement-level attribution impossible. You'll know the campaign total but not which channel drove it.
- Static QR codes: Static codes can't be tracked after printing or updated if a destination URL changes. A broken link on a printed piece kills all ROI from that placement — with no way to recover it.
- Counting scans as conversions: A scan is intent — it means someone pointed a camera at your code. ROI requires tracking the conversion event after the scan, not the scan itself. Bitly's survey confirms only 16% of marketers make this connection; the other 84% are measuring the wrong thing.
- Undercounting campaign costs: Businesses often report inflated ROI by omitting QR platform subscription fees, design costs, and distribution expenses. If those aren't in the denominator, the formula is wrong.
How to Improve QR Code ROI After Your First Campaign
Run Segmented A/B Comparisons
Create two unique dynamic QR codes for the same placement — same location, different CTA text, different design, or different offer. Compare scan-to-conversion rates over a statistically meaningful sample before calling a winner. UTM utm_content parameters differentiate the variants in Google Analytics so downstream behaviour is tracked separately.
Optimize for Device Type
QRStuff's device analytics typically show over 90% of scans coming from mobile users. If that holds for your campaigns, two checks are worth running:
- Test your post-scan landing page at mobile load speeds under real network conditions
- Audit page load time on 4G, not just Wi-Fi — slow loads kill conversions regardless of placement quality
Reallocate Budget Based on Channel Comparison
Use your first-campaign data to guide budget decisions:
- Pull revenue per scan and CPA by placement
- Shift budget toward highest-performing placements for the next run
- Use dynamic code URL updates to refresh offers on existing printed materials instead of reprinting from scratch
This last point matters for cost control: reprinting is expensive. Updating a destination URL in QRStuff takes seconds — no reprinting required, just your existing subscription.
Frequently Asked Questions
What is a good QR code scan rate for a marketing campaign?
Scan rates vary considerably by placement type, audience, and industry; no universal benchmark applies across channels. Conversion rate (scans to desired actions) is more meaningful than scan volume alone, since a smaller high-intent audience typically outperforms a larger passive one.
Can I track QR code conversions directly in Google Analytics?
Yes. Append UTM parameters to the QR destination URL and configure a conversion goal or key event in your GA4 account. Google Analytics will then attribute traffic and goal completions to the specific campaign, but only if the goal is configured before the campaign goes live.
What is the difference between total scans and unique scans?
Total scans count every scan event, including repeat scans from the same device. Unique scans count individual devices, so one device scanning three times equals one unique scan. Unique scans are the correct figure for estimating actual audience reach.
Do static QR codes affect ROI measurement?
Static QR codes cannot be tracked after printing and cannot have their destination URL changed. This makes them unsuitable for any campaign requiring scan analytics or mid-campaign optimization — dynamic QR codes are required for ROI measurement.
How long should a QR code campaign run before calculating ROI?
Short campaigns tied to events or limited offers can be assessed within days. Ongoing campaigns should accumulate enough conversion volume to be statistically meaningful, typically at least a full month, before drawing conclusions and reallocating budget.
What costs should be included when calculating QR code campaign ROI?
Factor in every expense tied to the campaign:
- QR platform subscription fees
- Design and creative production costs
- Printing and physical distribution
- Any paid promotion or media spend
Omitting any of these inflates your apparent ROI and leads to poor budget decisions in future campaigns.